![]()
Prometheus is a free software application used for event monitoring and alerting. It records real-time metrics in a time series database (allowing for high dimensionality) built using a HTTP pull model, with flexible queries and real-time alerting. Prometheus also has node exporters including windows to export OS specific metrics.
Step 1: Prometheus-Node-Exporter Windows
The official site containing Prometheus-Exporter for windows is https://github.com/prometheus-community/windows_exporter containing detailed installation instructions. The MSI executable can be downloaded from https://github.com/prometheus-community/windows_exporter/releases.
Download the MSI executable and copy it to your windows server. Open up a promt with administrative privileges and execute the exporter with the appropriate options to enable specific features:
| Name | Description | Enabled by default |
|---|---|---|
| ad | Active Directory Domain Services | |
| adfs | Active Directory Federation Services | |
| cache | Cache metrics | |
| cpu | CPU usage | ✓ |
| cpu_info | CPU Information | |
| cs | “Computer System” metrics (system properties, num cpus/total memory) | ✓ |
| container | Container metrics | |
| dfsr | DFSR metrics | |
| dhcp | DHCP Server | |
| dns | DNS Server | |
| exchange | Exchange metrics | |
| fsrmquota | Microsoft File Server Resource Manager (FSRM) Quotas collector | |
| hyperv | Hyper-V hosts | |
| iis | IIS sites and applications | |
| logical_disk | Logical disks, disk I/O | ✓ |
| logon | User logon sessions | |
| memory | Memory usage metrics | |
| msmq | MSMQ queues | |
| mssql | SQL Server Performance Objects metrics | |
| netframework_clrexceptions | .NET Framework CLR Exceptions | |
| netframework_clrinterop | .NET Framework Interop Metrics | |
| netframework_clrjit | .NET Framework JIT metrics | |
| netframework_clrloading | .NET Framework CLR Loading metrics | |
| netframework_clrlocksandthreads | .NET Framework locks and metrics threads | |
| netframework_clrmemory | .NET Framework Memory metrics | |
| netframework_clrremoting | .NET Framework Remoting metrics | |
| netframework_clrsecurity | .NET Framework Security Check metrics | |
| net | Network interface I/O | ✓ |
| os | OS metrics (memory, processes, users) | ✓ |
| process | Per-process metrics | |
| remote_fx | RemoteFX protocol (RDP) metrics | |
| service | Service state metrics | ✓ |
| smtp | IIS SMTP Server | |
| system | System calls | ✓ |
| tcp | TCP connections | |
| time | Windows Time Service | |
| thermalzone | Thermal information | |
| terminal_services | Terminal services (RDS) | |
| textfile | Read prometheus metrics from a text file | ✓ |
| vmware | Performance counters installed by the Vmware Guest agent |
For example to install on an Active Directory Server use:
# msiexec /i windows_exporter-0.31.2-amd64.msi ENABLED_COLLECTORS="ad,dns,cpu,memory,net,logical_disk,os,process,service,vmware,time,cache,cpu_info,tcp,udp,license,vmware"
For example to install on an Exchange Server use:
# msiexec /i windows_exporter-0.31.2-amd64.msi ENABLED_COLLECTORS="exchange,mscluster,iis,cpu,memory,net,logical_disk,os,process,service,vmware,time,cache,cpu_info,tcp,udp,license,vmware"
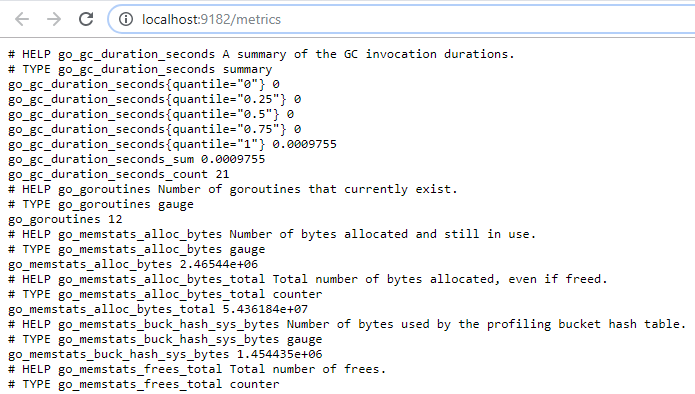
One can test the metric value exports by visiting the url http://localhost:9182/metrics, as an example below:
Step 2: Prometheus Binding
The official site containing Prometheus-Exporter for windows is https://github.com/prometheus-community/windows_exportercontaining detailed installation instructions. The MSI executable can be downloaded
scrape_configs:
# The job name is added as a label `job=<job_name>` to any timeseries scraped from this config.
  - job_name: 'remote-hosts'

    # Careful, the scrape timeout has to be lower than the scrape interval.
    scrape_interval: 6s
    scrape_timeout: 5s
    static_configs:
            - targets: ['remote-01:9182', 'remote-02:9182']
Restart Prometheus and review the collection process
# sudo systemctl restart prometheus
# sudo systemctl status prometheus