Prometheus and Grafana support various integrations including Pihole, following guide will provide instructions on how to integrate these products for interactive statistics and reporting.
Step 1: Reference
The primary projects for this integration are:
- Prometheus Pihole exporter: https://github.com/eko/pihole-exporter
- Grafana panel: https://grafana.com/grafana/dashboards/10176-pi-hole-exporter/
Step 2: Basic Installation
In my example I use binaries, no docker or go modules to install and configure the Prometheus exporter.
# mkdir /opt/pihole_exporter/
# cd /opt/pihole_exporter/
# wget https://github.com/eko/pihole-exporter/releases/latest/download/pihole_exporter-linux-amd64
# chown root:root /opt/pihole_exporter/pihole_exporter-linux-amd64
Create a user (no password, no shell)
# adduser --shell /usr/sbin/nologin --disabled-password --home /opt/pihole_exporter pihole_exporter
Step 3: Create a systemd startup file
Create a new systemd startup file /lib/systemd/system/pihole_exporter.service with the following details:
- In the example below I use HTTPS as a pihole protocl
- When using HTTPS, the exporter validates SAN certificates names, so make sure it aligns.
- In the example below I use user/password as authetnication, but a authentication API token is also supported
[Unit]
Description=pihole_exporter

[Service]
ExecStart=/opt/pihole_exporter/pihole_exporter-linux-amd64 -pihole_hostname adguard-01.mydomain.local -pihole_password xxxxxxxx -pihole_protocol https -pihole_port 443 WorkingDirectory=/opt/pihole_exporter
Restart=always
User=pihole_exporter

[Install]
WantedBy=multi-user.target
Step 4: Startup comments
Make sure systemd is reloaded and process started
# systemctl daemon-reload
# systemctl start pihole_exporter
# systemctl eanble pihole_exporter
Monitor syslog for details that it properly starts-up, monitor that it actually polls information once the prometheus server is configured:
# tail -f /var/log/syslog
Step 5: Prometheus Polling
Prometheus must be configured to poll the defined pihole instances, edit its configuration file /etc/prometheus/prometheus.yml and add pihole polling information:
  - job_name: pihole
    scrape_interval: 15s
    scrape_timeout: 10s
    static_configs:
      - targets: ['adguard-01:9617', 'adguard-02:9617' ]
    relabel_configs:
      - source_labels: ['__address__']
        separator:     ':'
        regex:         '(.*):.*'
        target_label:  'instance'
        replacement:   '${1}'
Restart prometheus:
# systemctl restart prometheus
Monitor syslog for details that it properly starts-up, monitor that it actually polls information once the prometheus server is configured by visiting your prometheus server on http://<server>:9090 and viewing polling information.
Step 6: Grafana
Make sure the pichart panel is avaiable in grafana, on the server download this panel
# grafana-cli plugins install grafana-piechart-panel
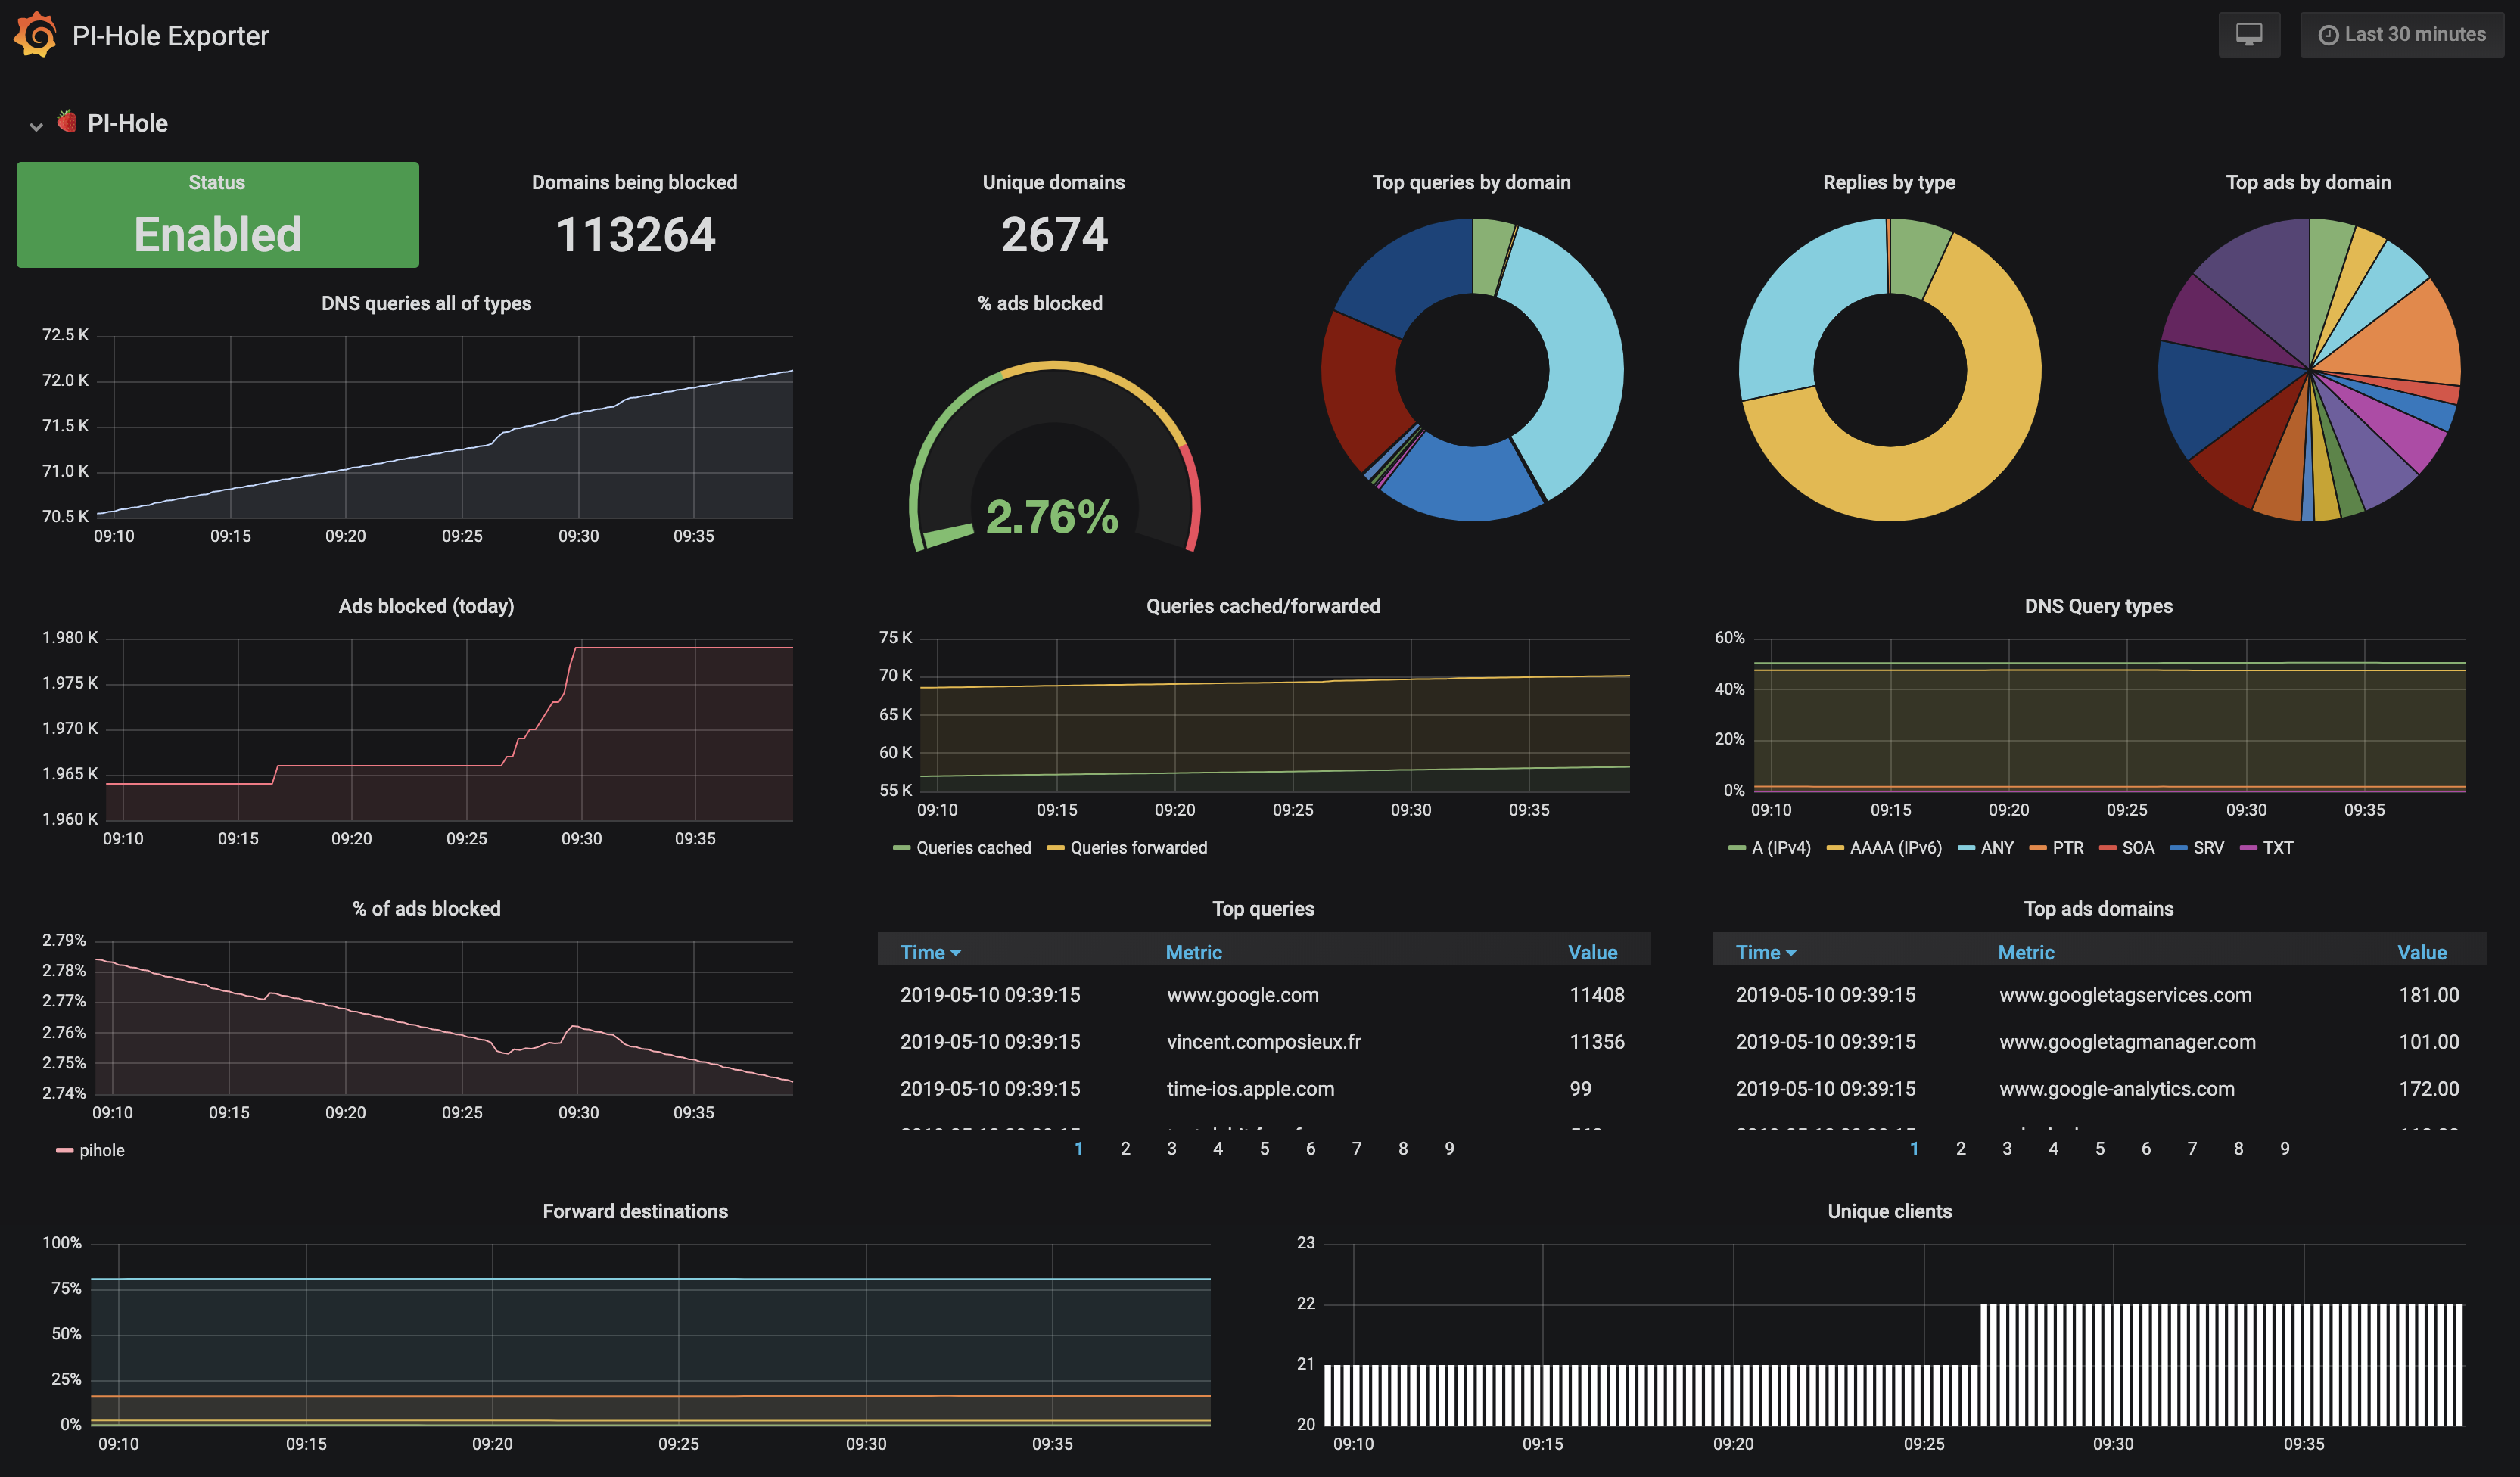
The actual dashboard is available through id: 10176 or see https://grafana.com/grafana/dashboards/10176-pi-hole-exporter/. I had to customize the dashboard to support multiple instances, but if you know grafana, that is 1 minute of work. Have fun.